security risk loading
Company project · Security risk & findings monitoring

Security Risk seen, owned, resolved

The command view for an organisation’s digital security: attacks watched as they happen, hacking reported, every risk and finding scored by level, assigned to a team and tracked to closed, with the stage that holds things up and each team’s SLA in plain sight.

  • UX · UIMy role
  • 4Risk levels
  • 14Dashboards
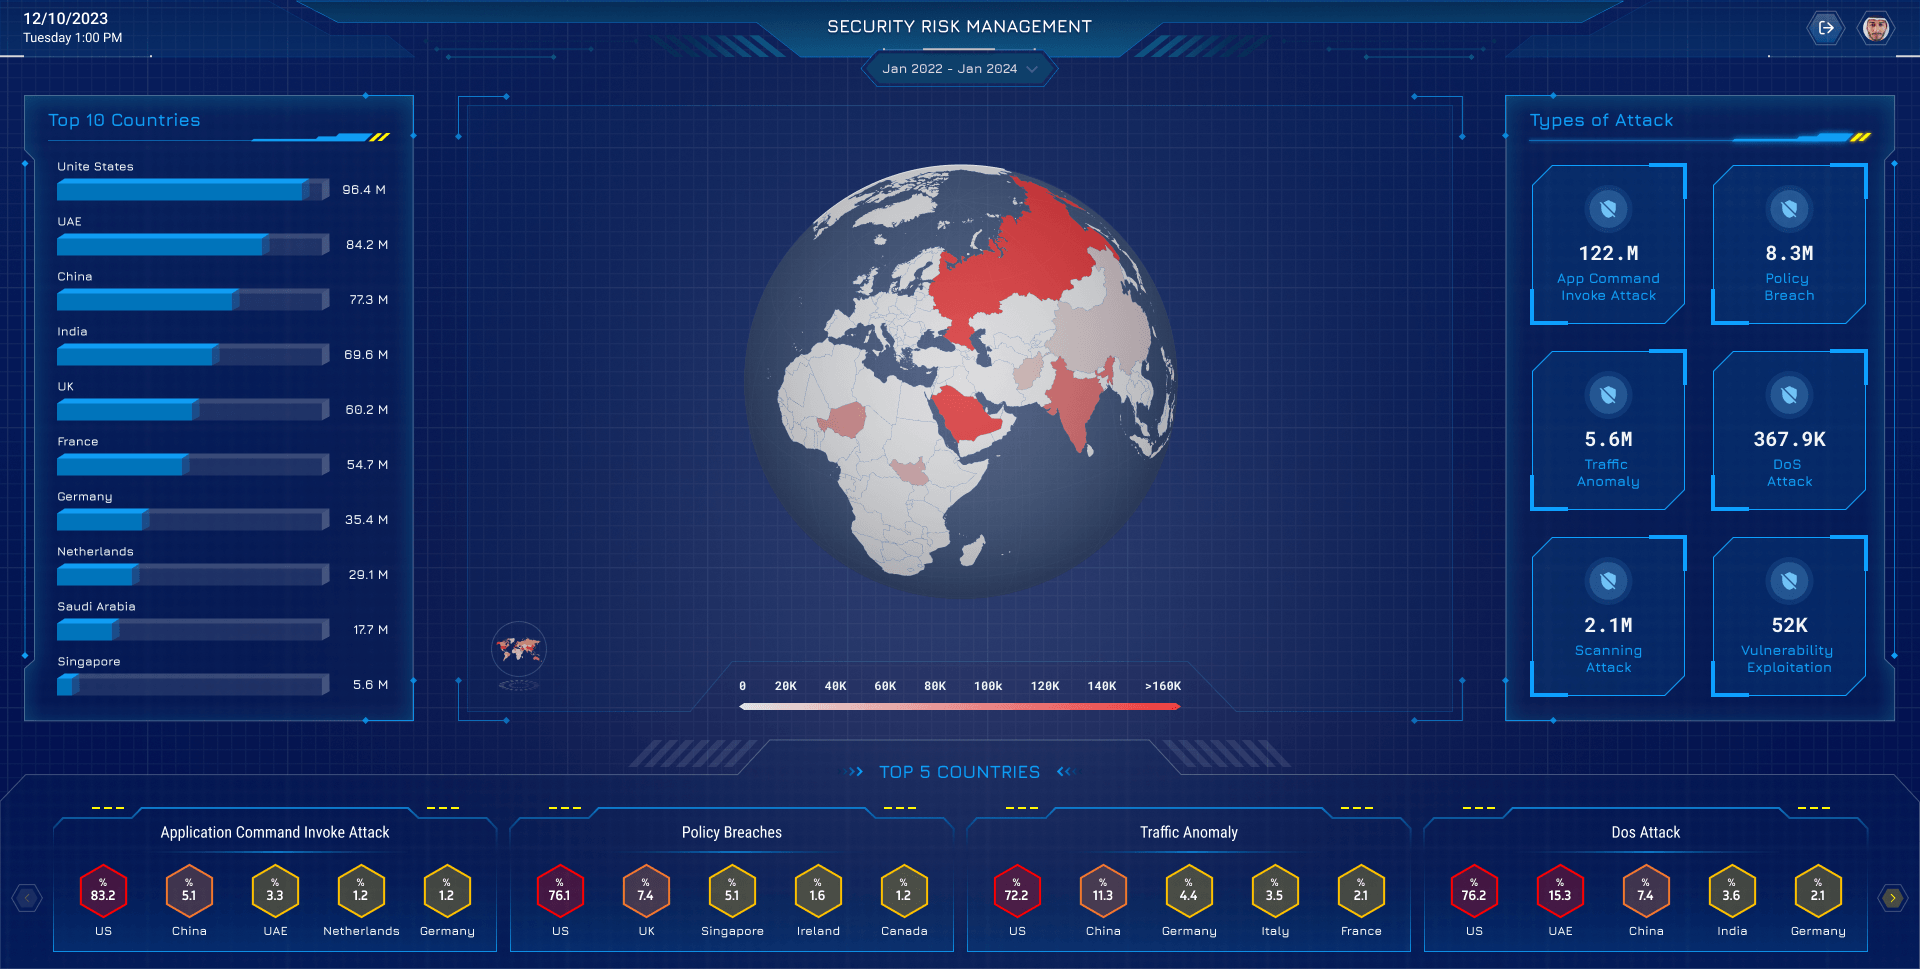
Attacks by country on a globe, by type and the top five countries for each
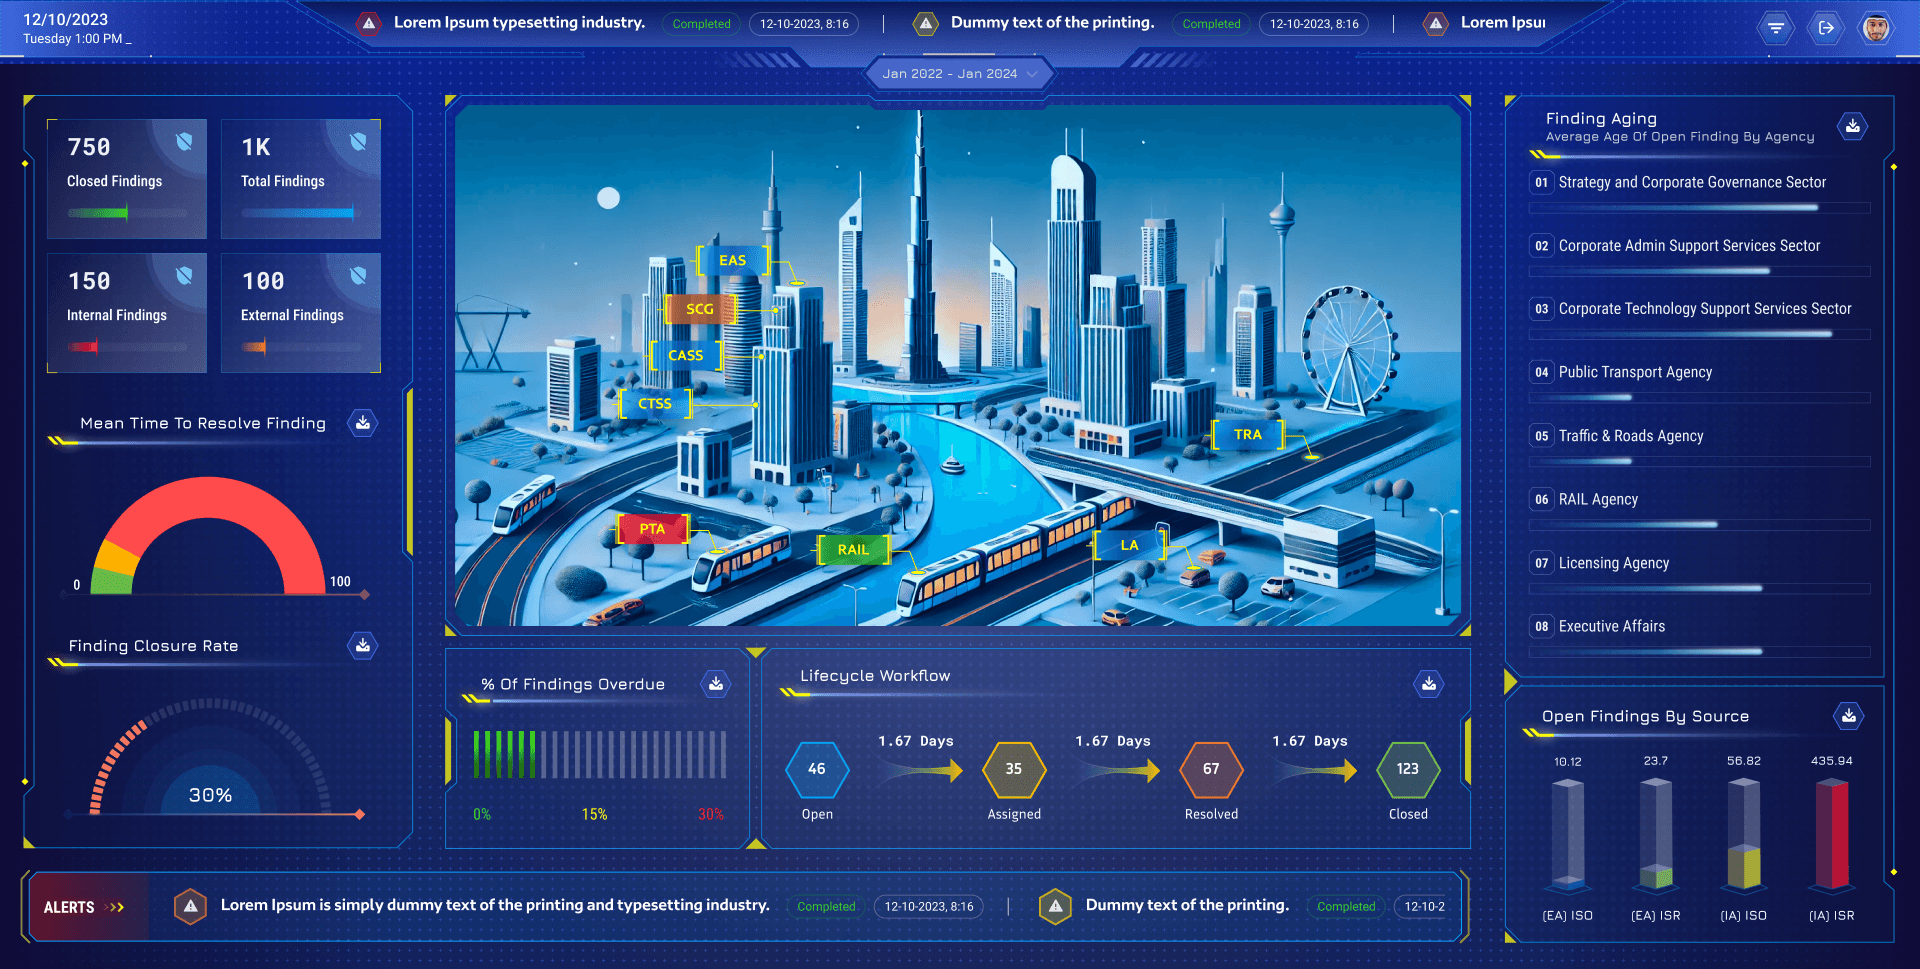
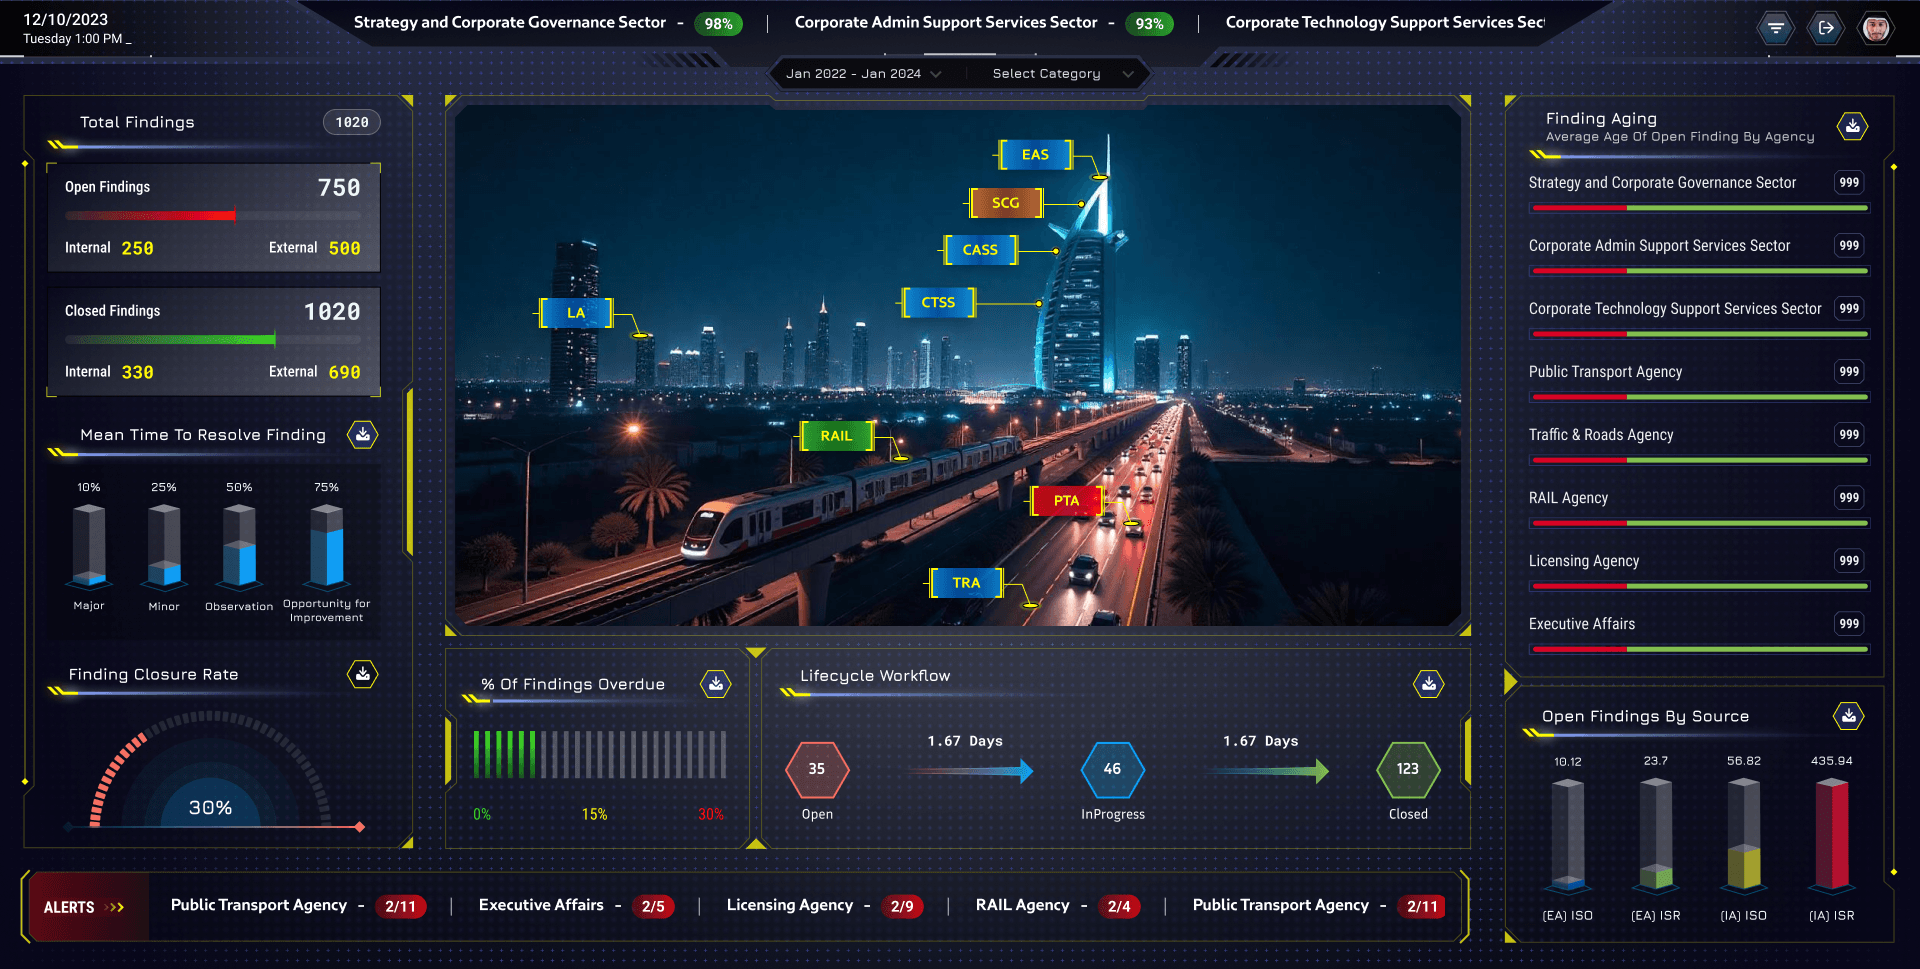
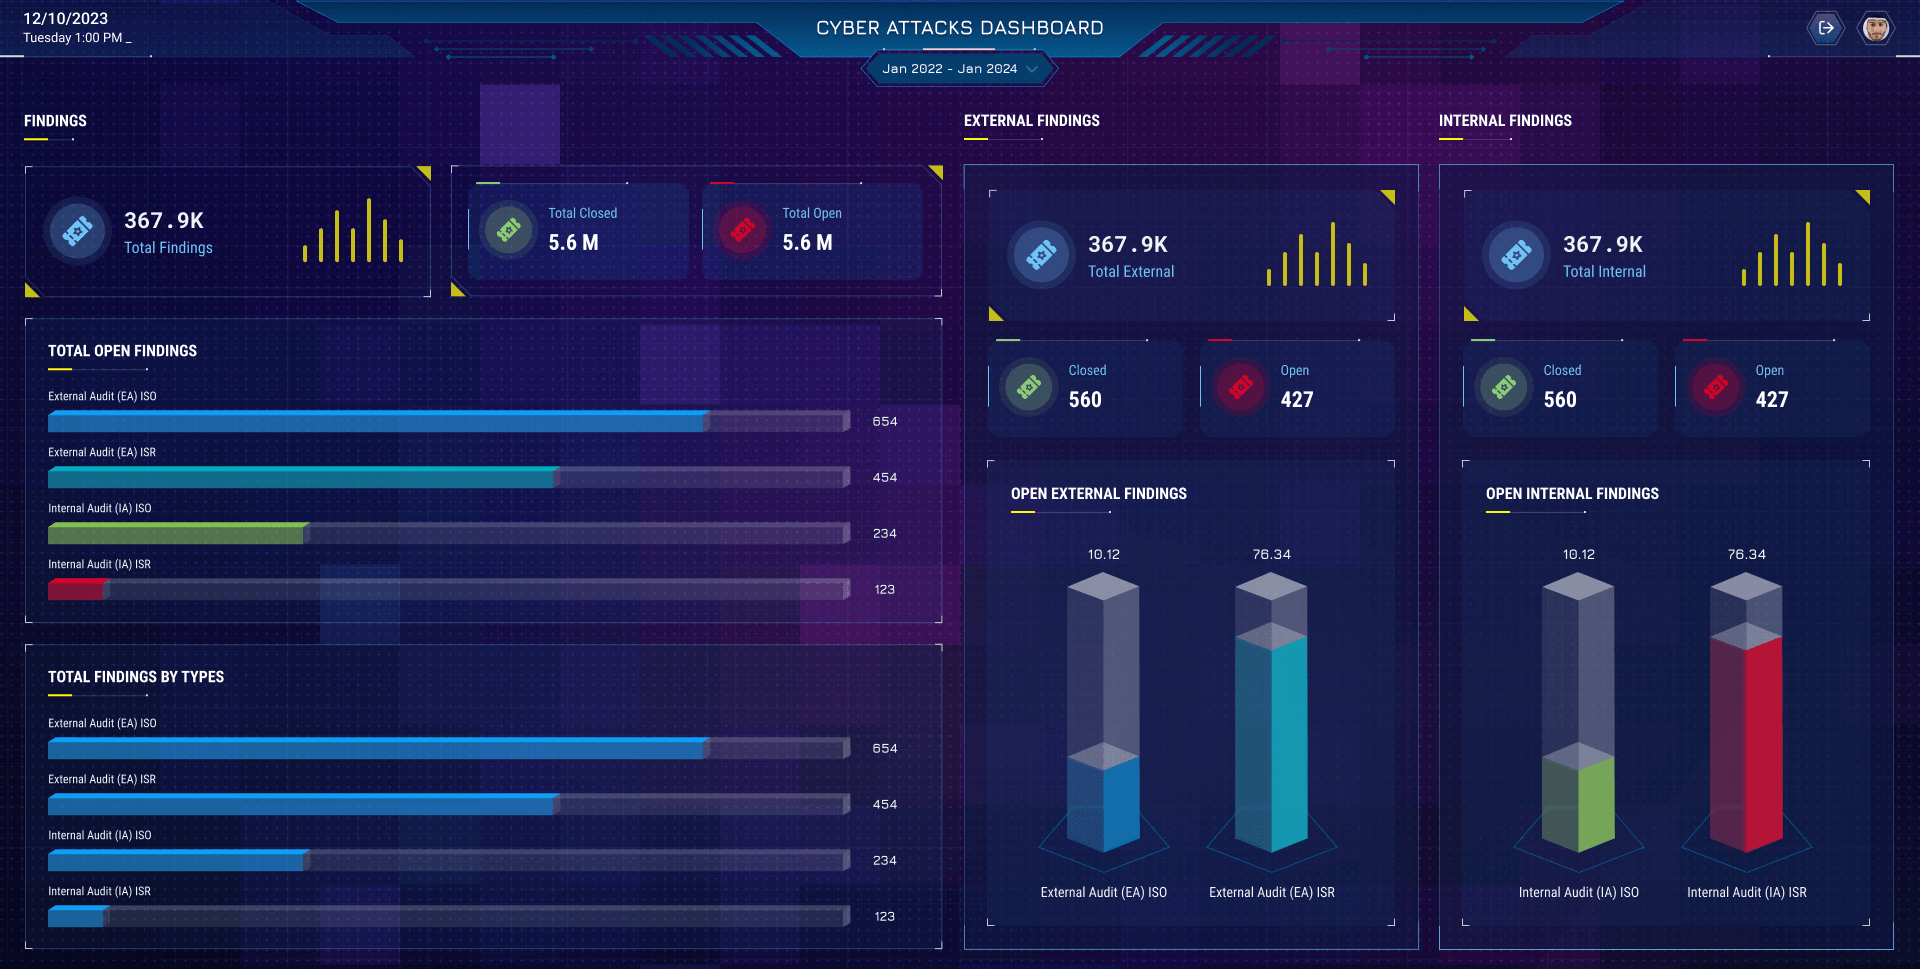
Security findings: counts, the city map by agency, the lifecycle and finding aging
Security Risk Management
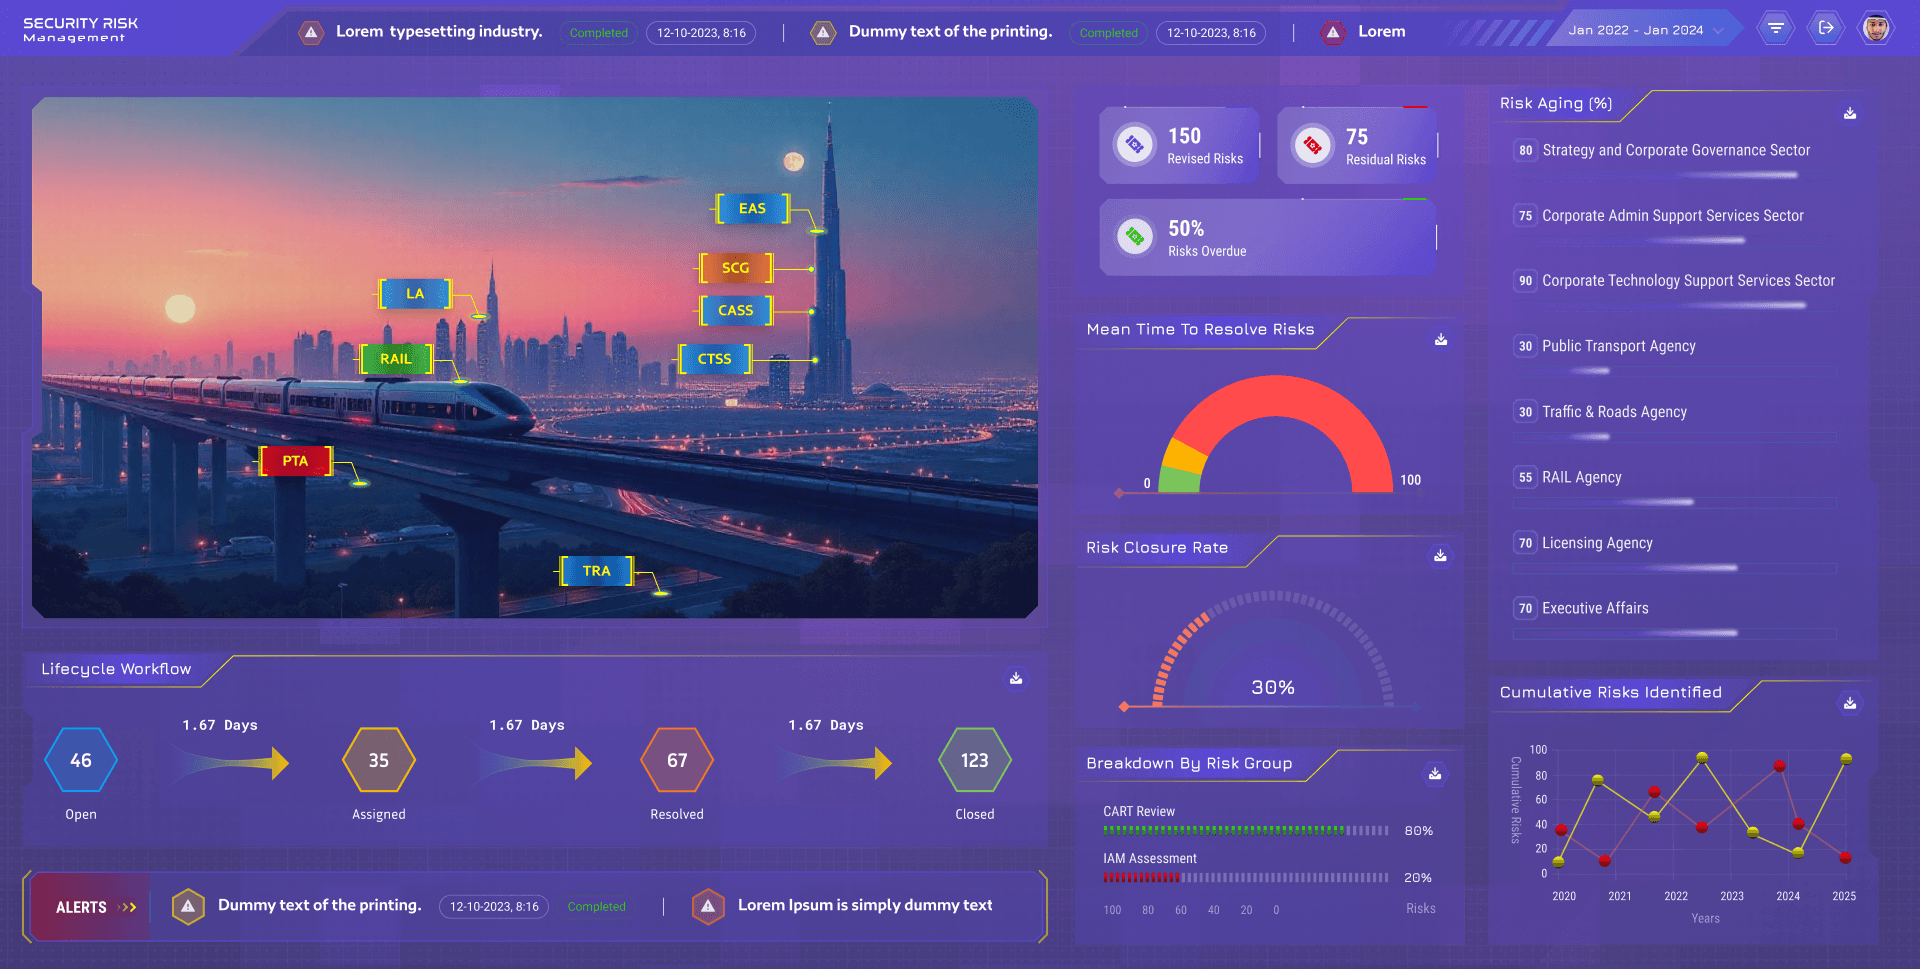
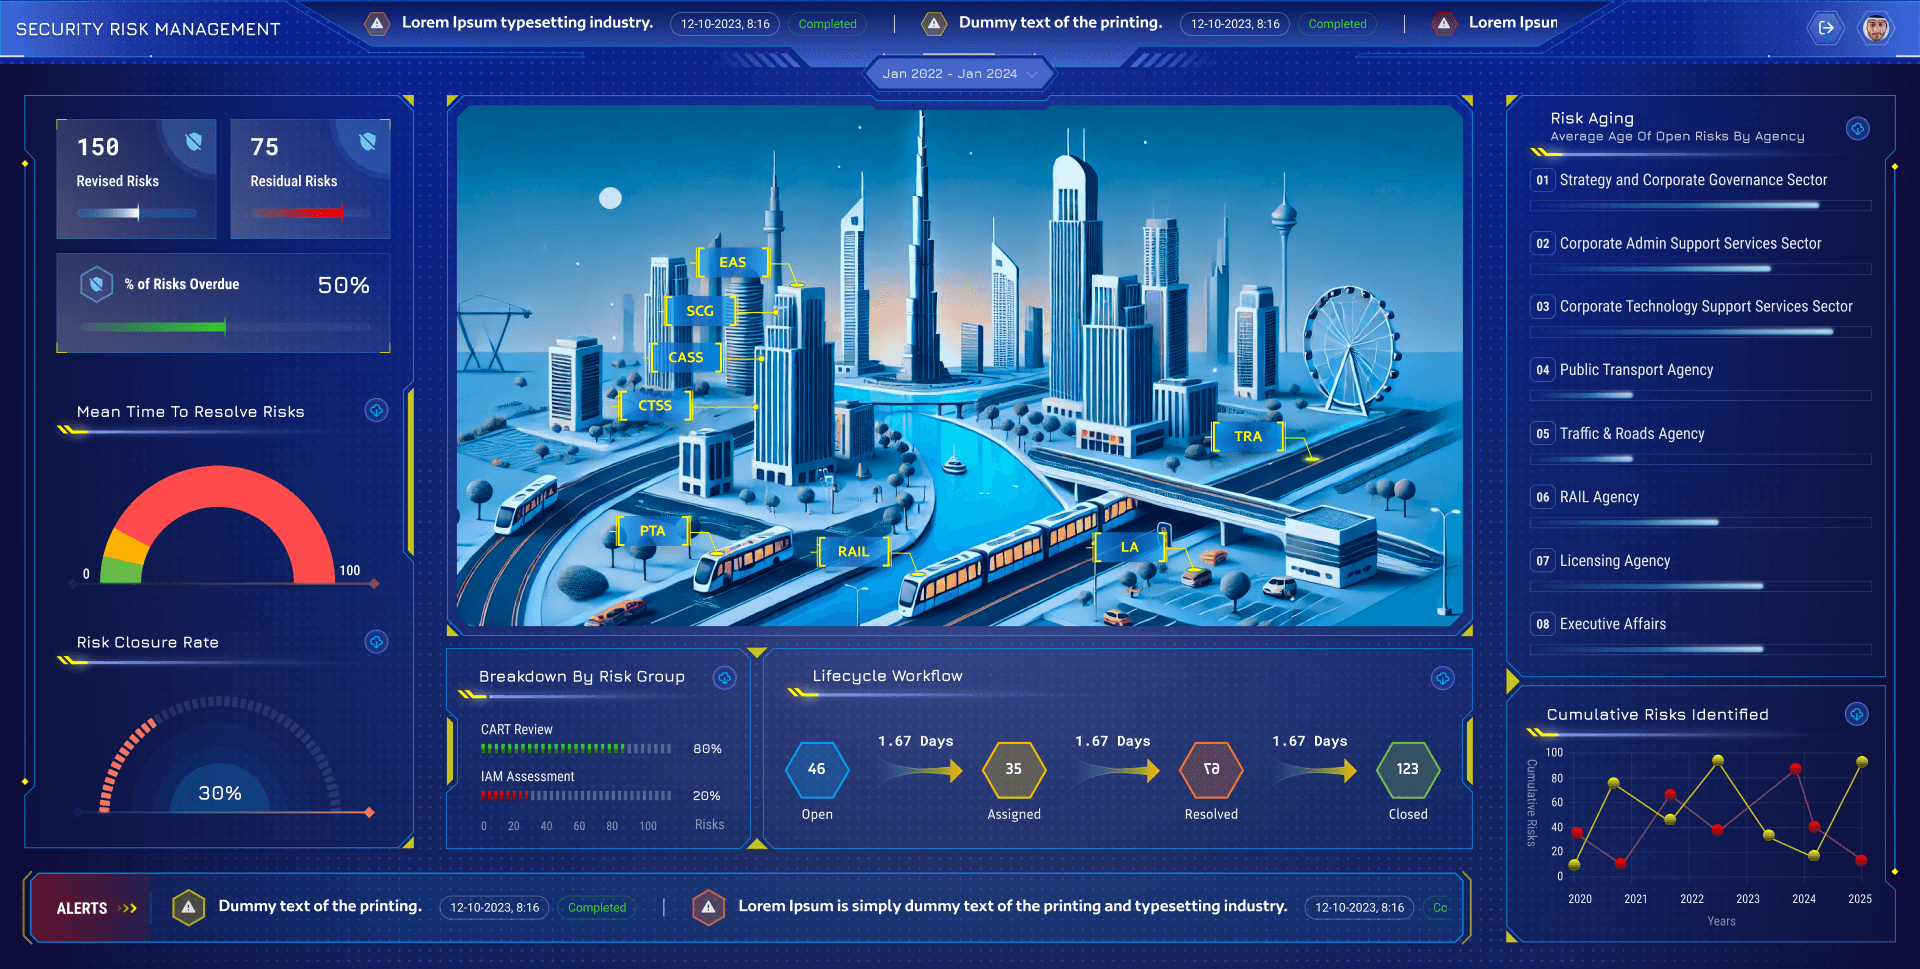
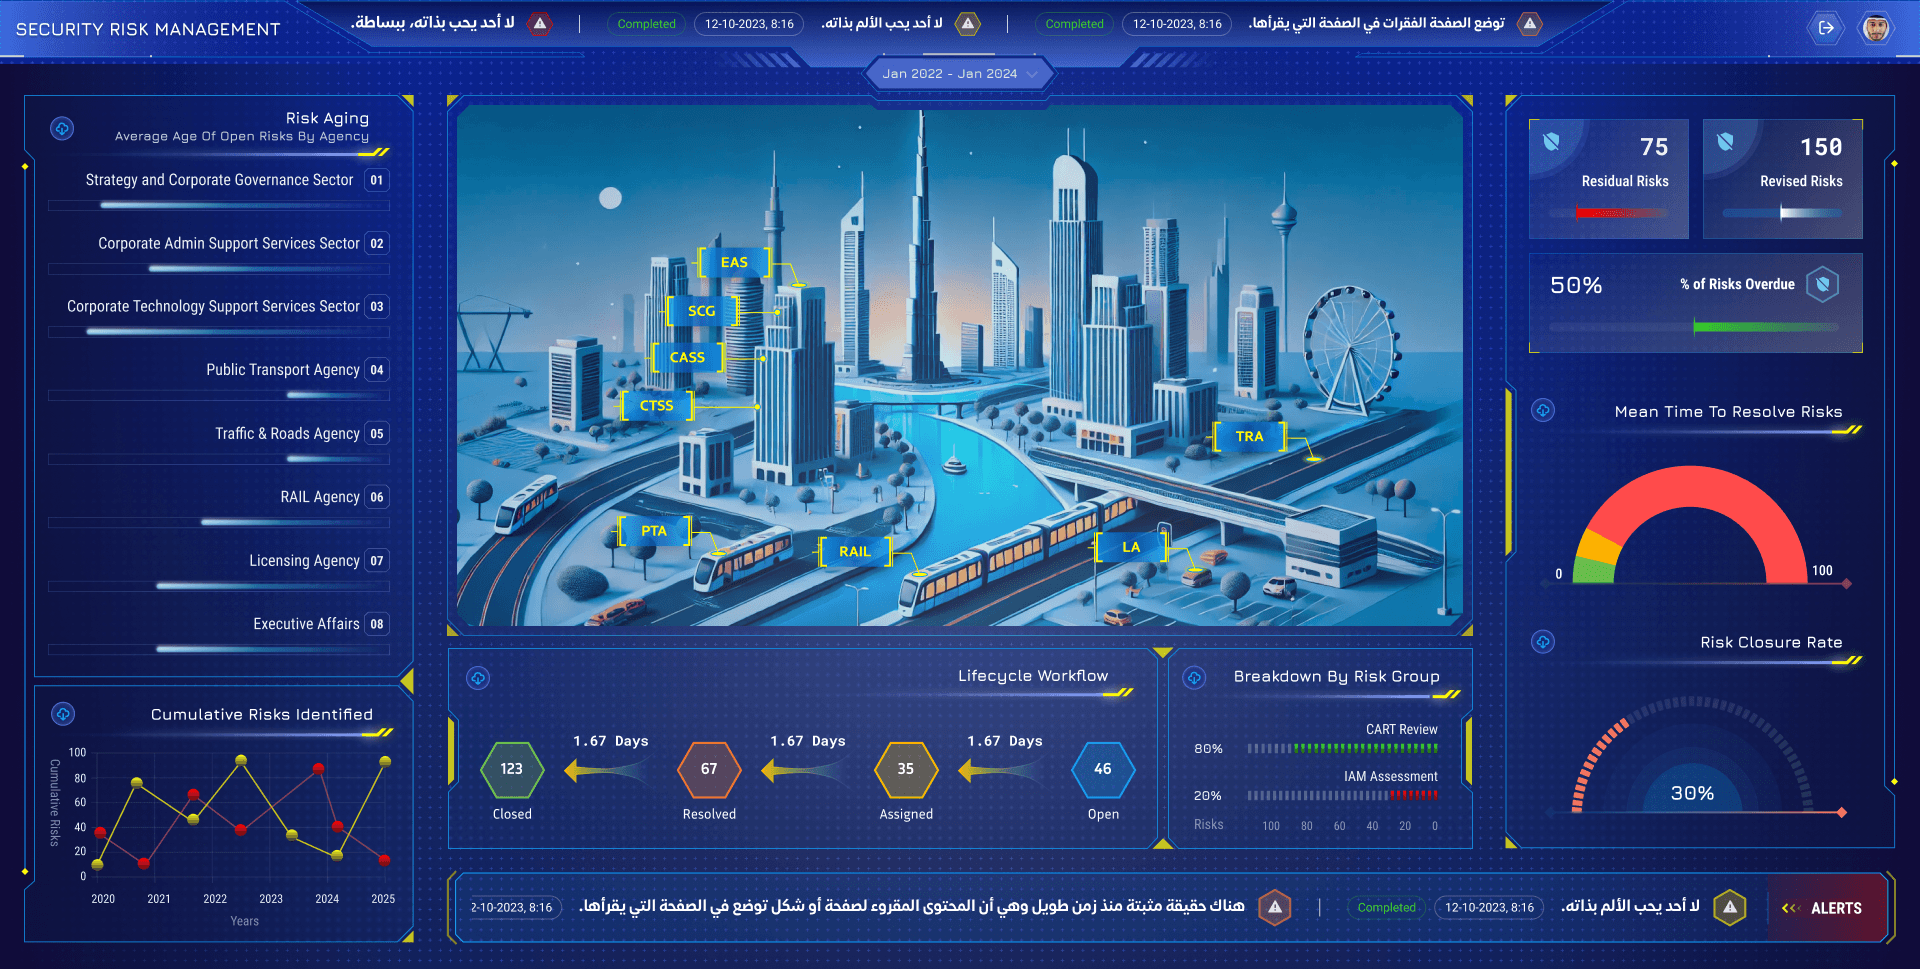
Security risk management: risks on the city map by agency, mean time to resolve, risk aging and the lifecycle
Overview

From reports after the fact to risk you can steer

The shift

  1. Attacks counted in each tool, then pasted into slides
    Attacks by type, country and source, live; hacking reported from the same view
  2. Findings kept in audit spreadsheets, one per audit
    Internal and external findings together, by agency, source and age
  3. No one could say where a fix was stuck
    Open to closed in four steps, the days between each, the slowest one flagged
  4. One deadline for every finding, missed or not
    An SLA per risk level, and each team’s record against it

My role

  1. 01UXRisks, findings and attacks, for the board room and the security team
  2. 02UI design14 dashboards, Arabic and English, blue, black and light
  3. 03Design systemHexagon lifecycle, gauges, 3D bars and the agency city map

In numbers

4Stages, open to closed, each timed
14Dashboards
3Themes, in Arabic and English

Levels and their SLA

  • Critical2 days
  • High5 days
  • Medium15 days
  • Low30 days

What it watches

  • RisksRevised & residual risksRisk heatmapRisk aging by agencyMean time to resolve
  • FindingsInternal & externalBy sourceOverdueLifecycleClosure rate
  • AttacksBy countryBy typeThreat groupsIndicators of compromiseAlerts by source
  • TeamsAssignmentSLA per levelBottlenecksHacking reportsCoverage

Tools & methods

  • Figma
  • UI/UX design
The core

Where the fix is waiting

Findings move from open to closed through four stages. Pick a risk level to see its SLA, how long each stage takes against its target, the stage that holds things up and how every team keeps to it. New findings and hacking reports keep coming in. It runs on its own; pick a level or a stage and it’s yours.

  • 0Open findings
  • 0Over the SLA
  • 0 dMean time to resolve
  • 0%Closed within the SLA

Lifecycle

Pick a stage

    Where the days go

    Team SLA

    Critical

      Live

      Findings & reports
        One design, three ways

        Arabic and English, blue, black and light

        The dashboards mirror for Arabic and come in three looks for the wall, the night shift and the office. Drag across the screen to wipe between them.

        Security risks
        English Arabic
        14 key dashboards · 3 parts
        1. Security risks, by agency

          Revised and residual risks, the city map by agency, how fast they’re resolved and how old they are.

        2. Risks, in daylight

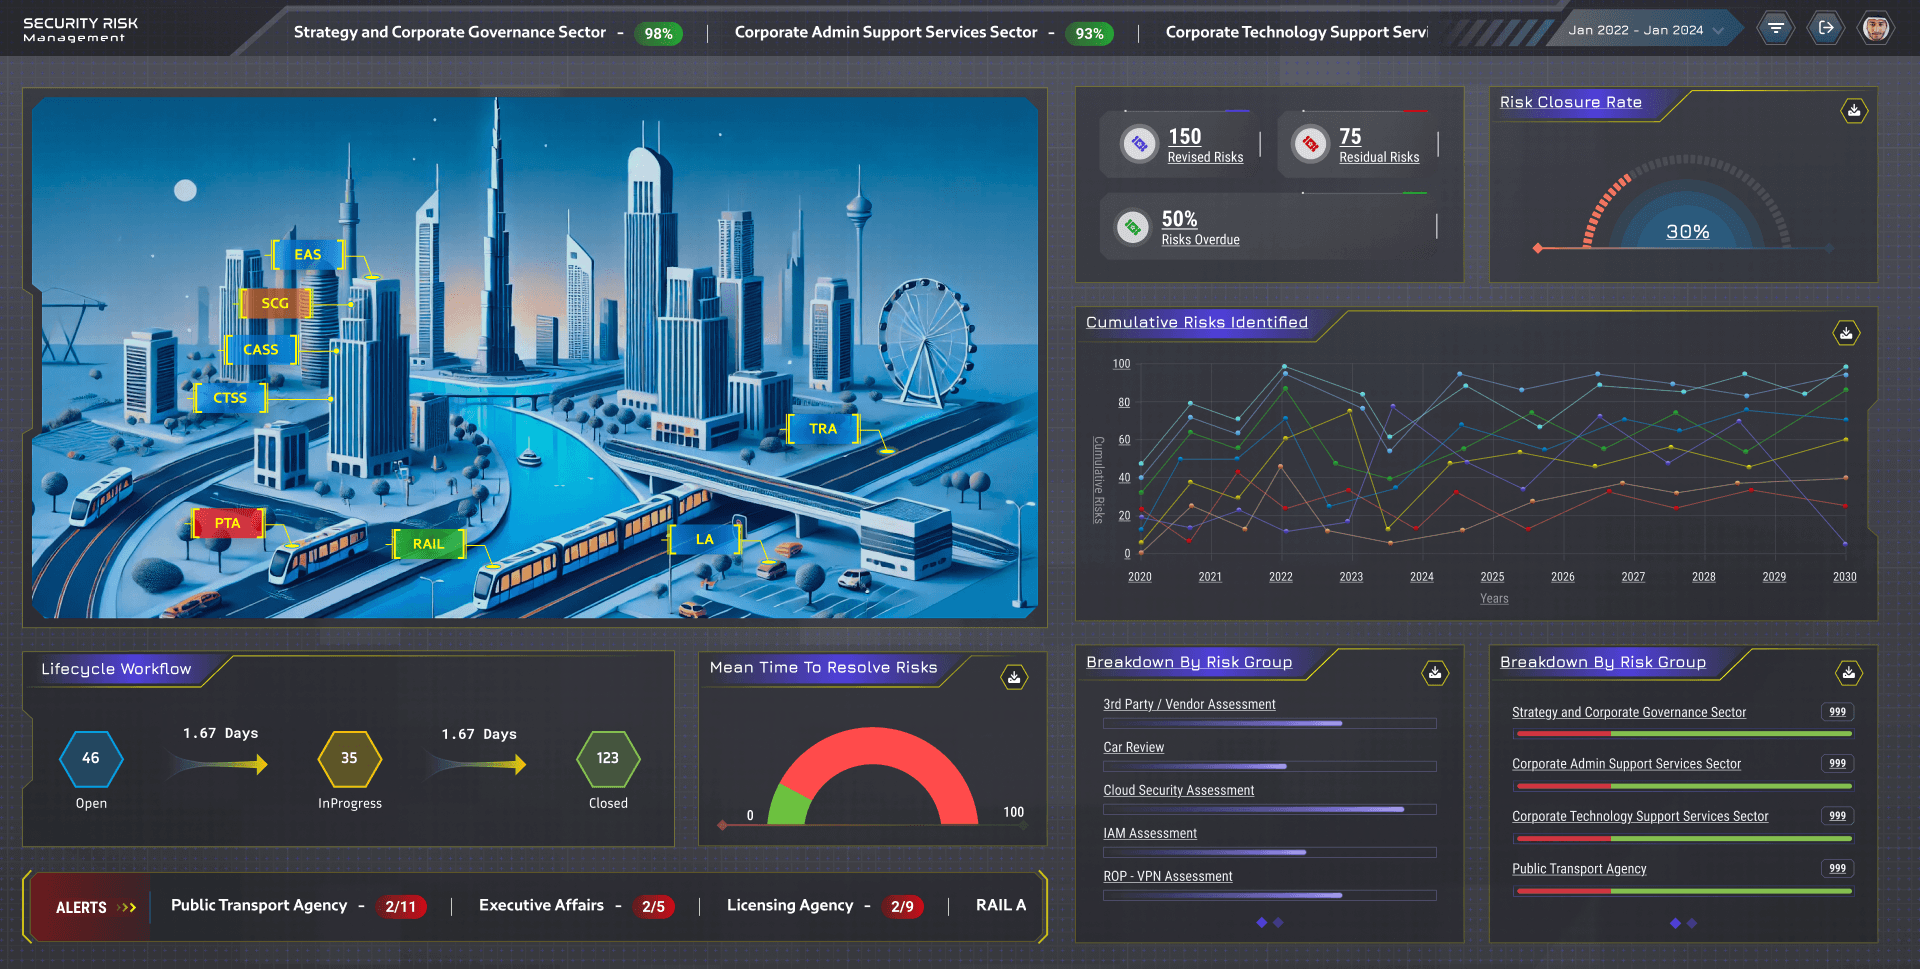
          The same view on the day map, with the share of risks overdue.

        3. By sector, over time

          Each sector’s score in the header, cumulative risks by year and the breakdown by assessment.

        4. In Arabic

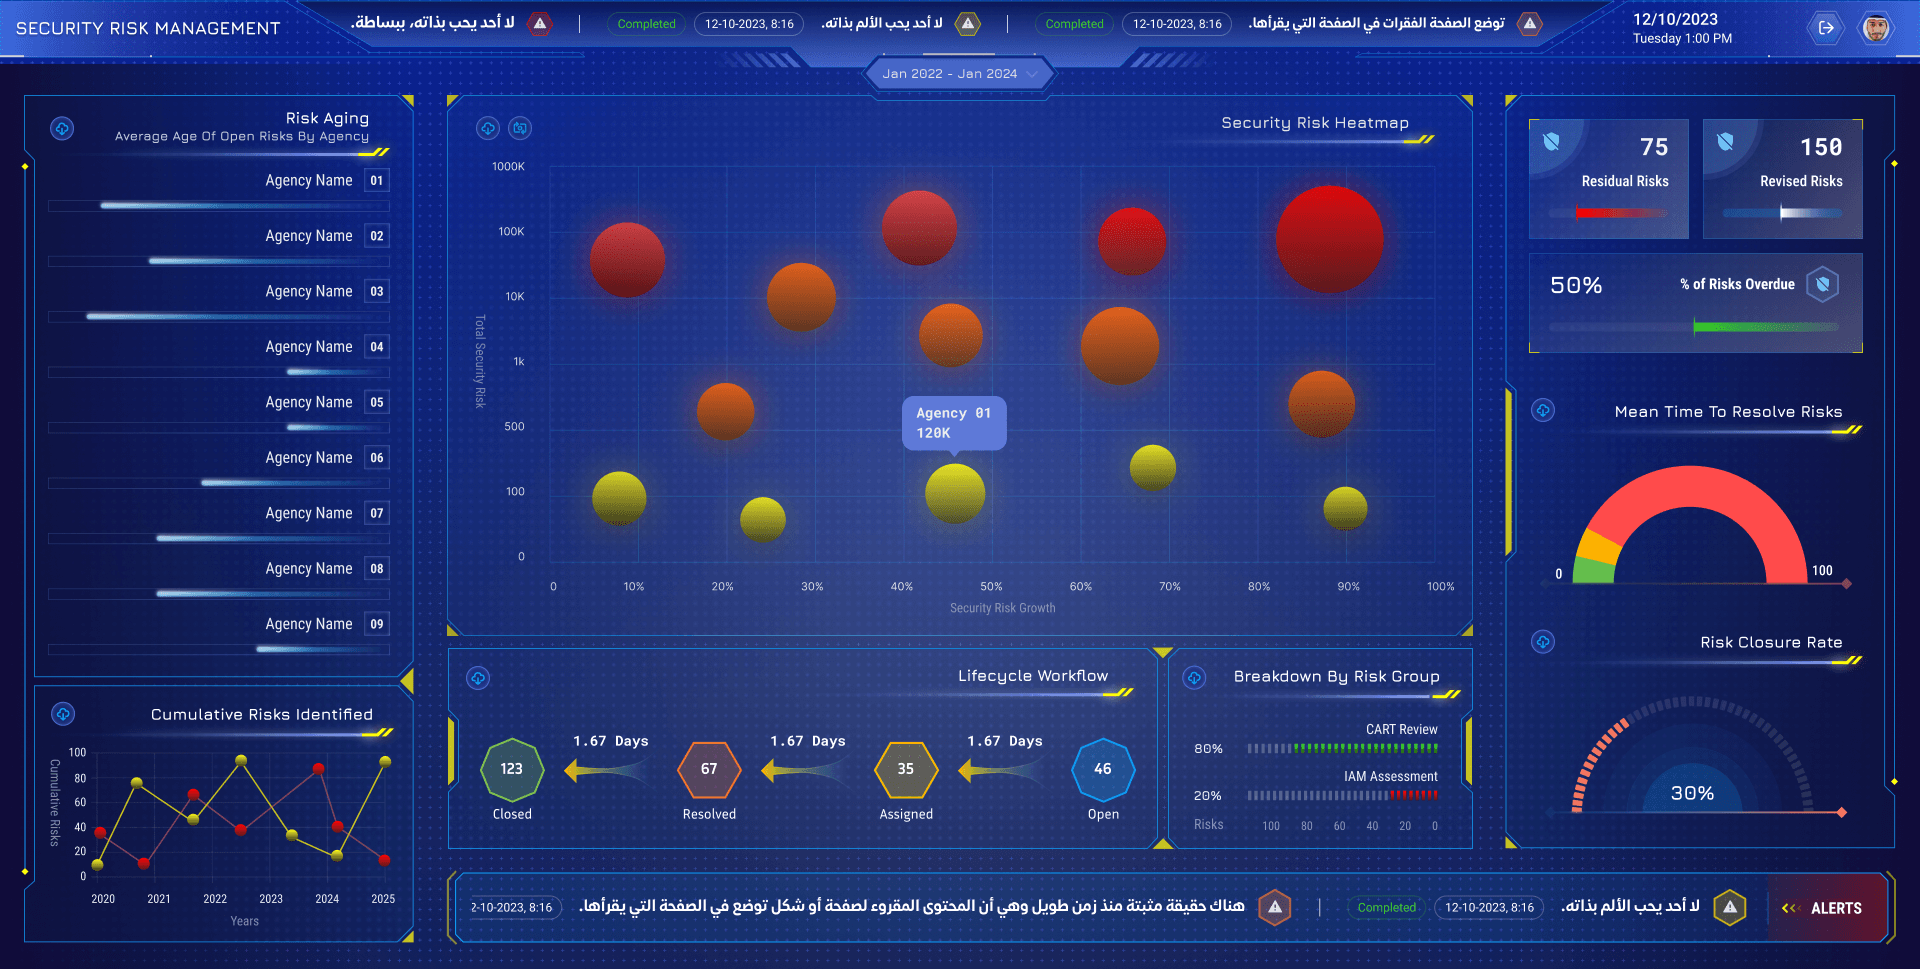
          Mirrored for right to left, every chart turned round.

        5. The risk heatmap

          Every agency as a bubble: how big its risk is, and how fast it grows.

        6. Security findings

          Closed, total, internal and external findings, their age, source and how fast they close.

        7. Findings at night

          Internal and external split, and time to resolve by severity.

        8. Findings by audit

          Open findings for each internal and external audit.

        9. Where the attacks came from

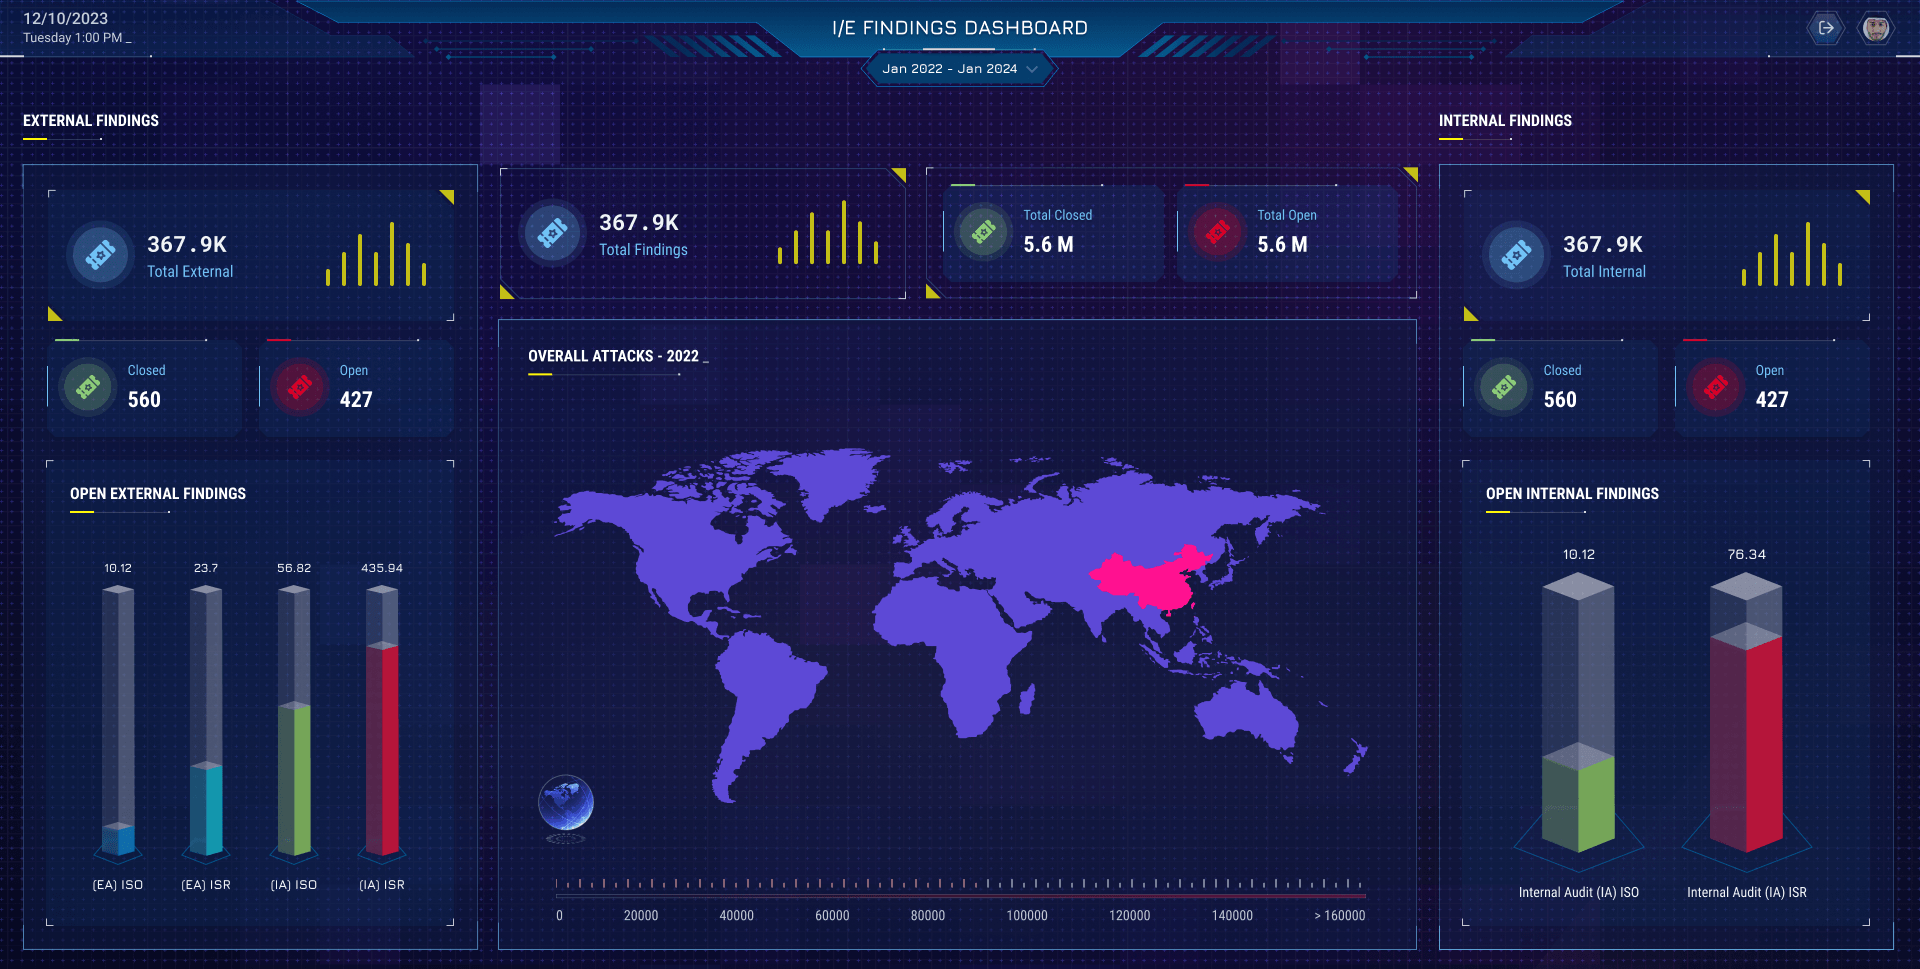
          Internal and external findings either side of the attack map.

        10. Findings, all together

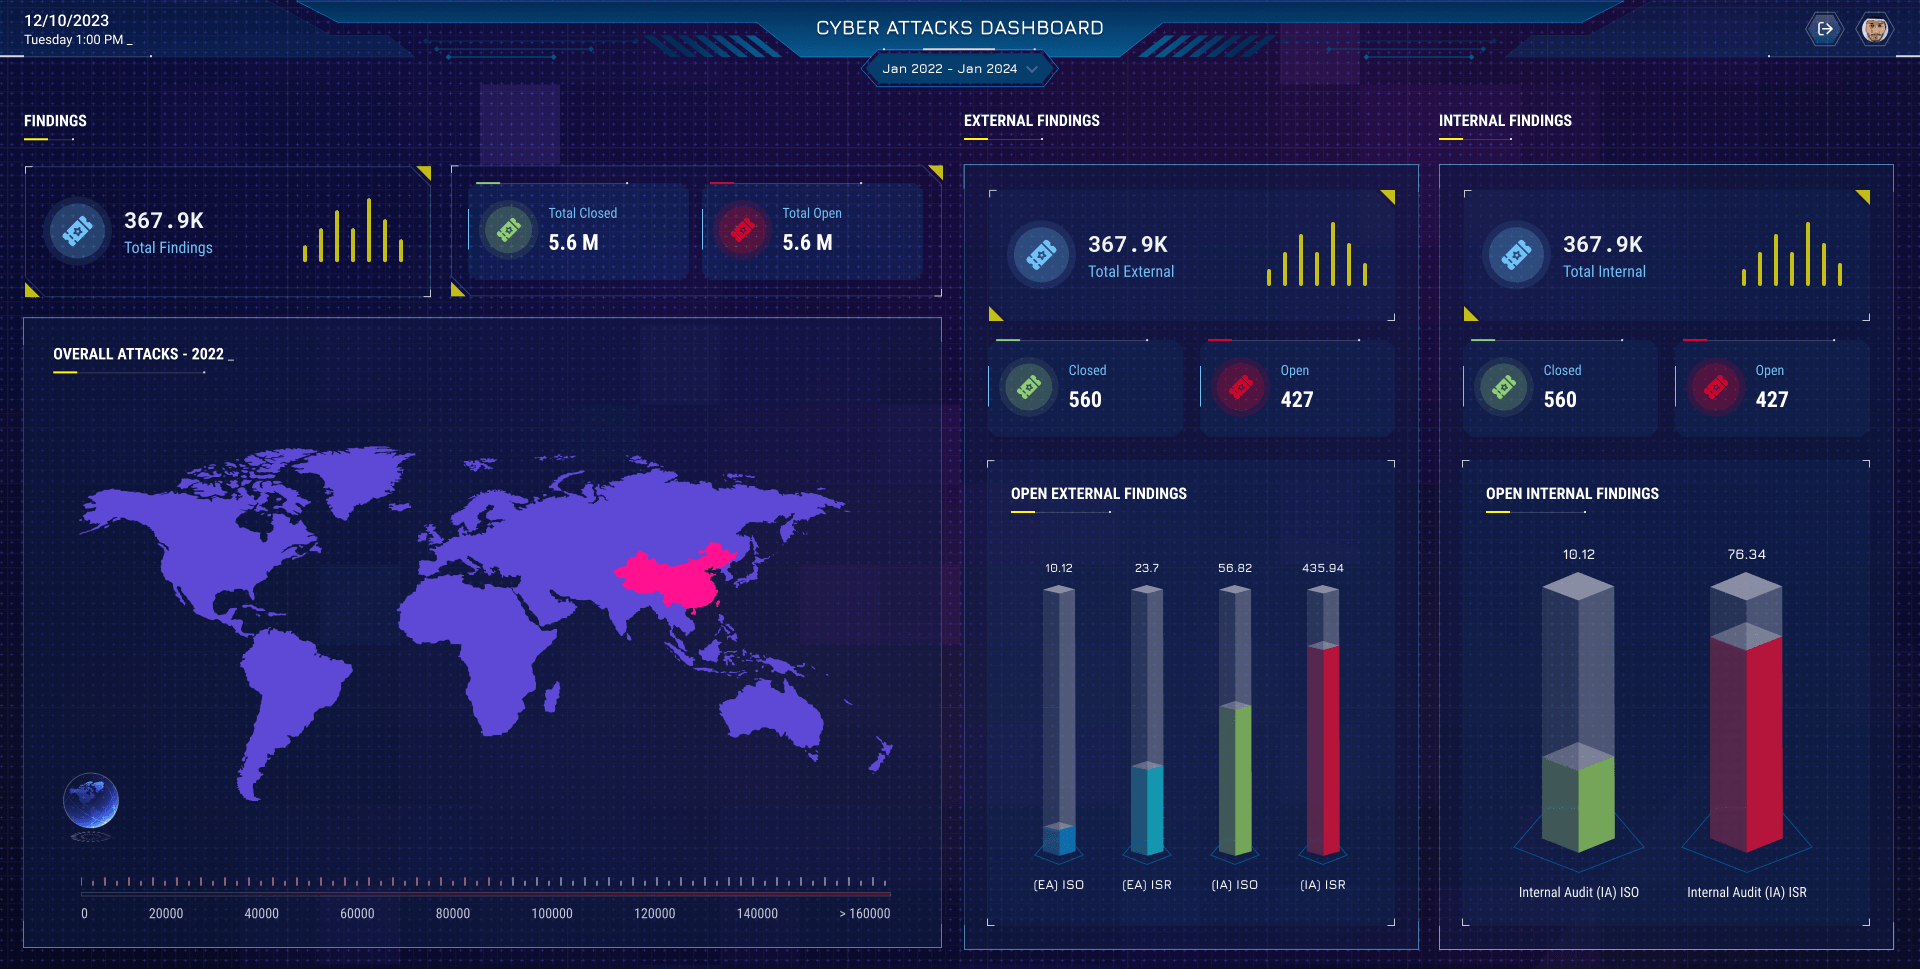
          Total, closed and open across both, over the map.

        11. Attacks, by country

          The top countries on a globe, attacks by type and the top five for each.

        12. Security alerts

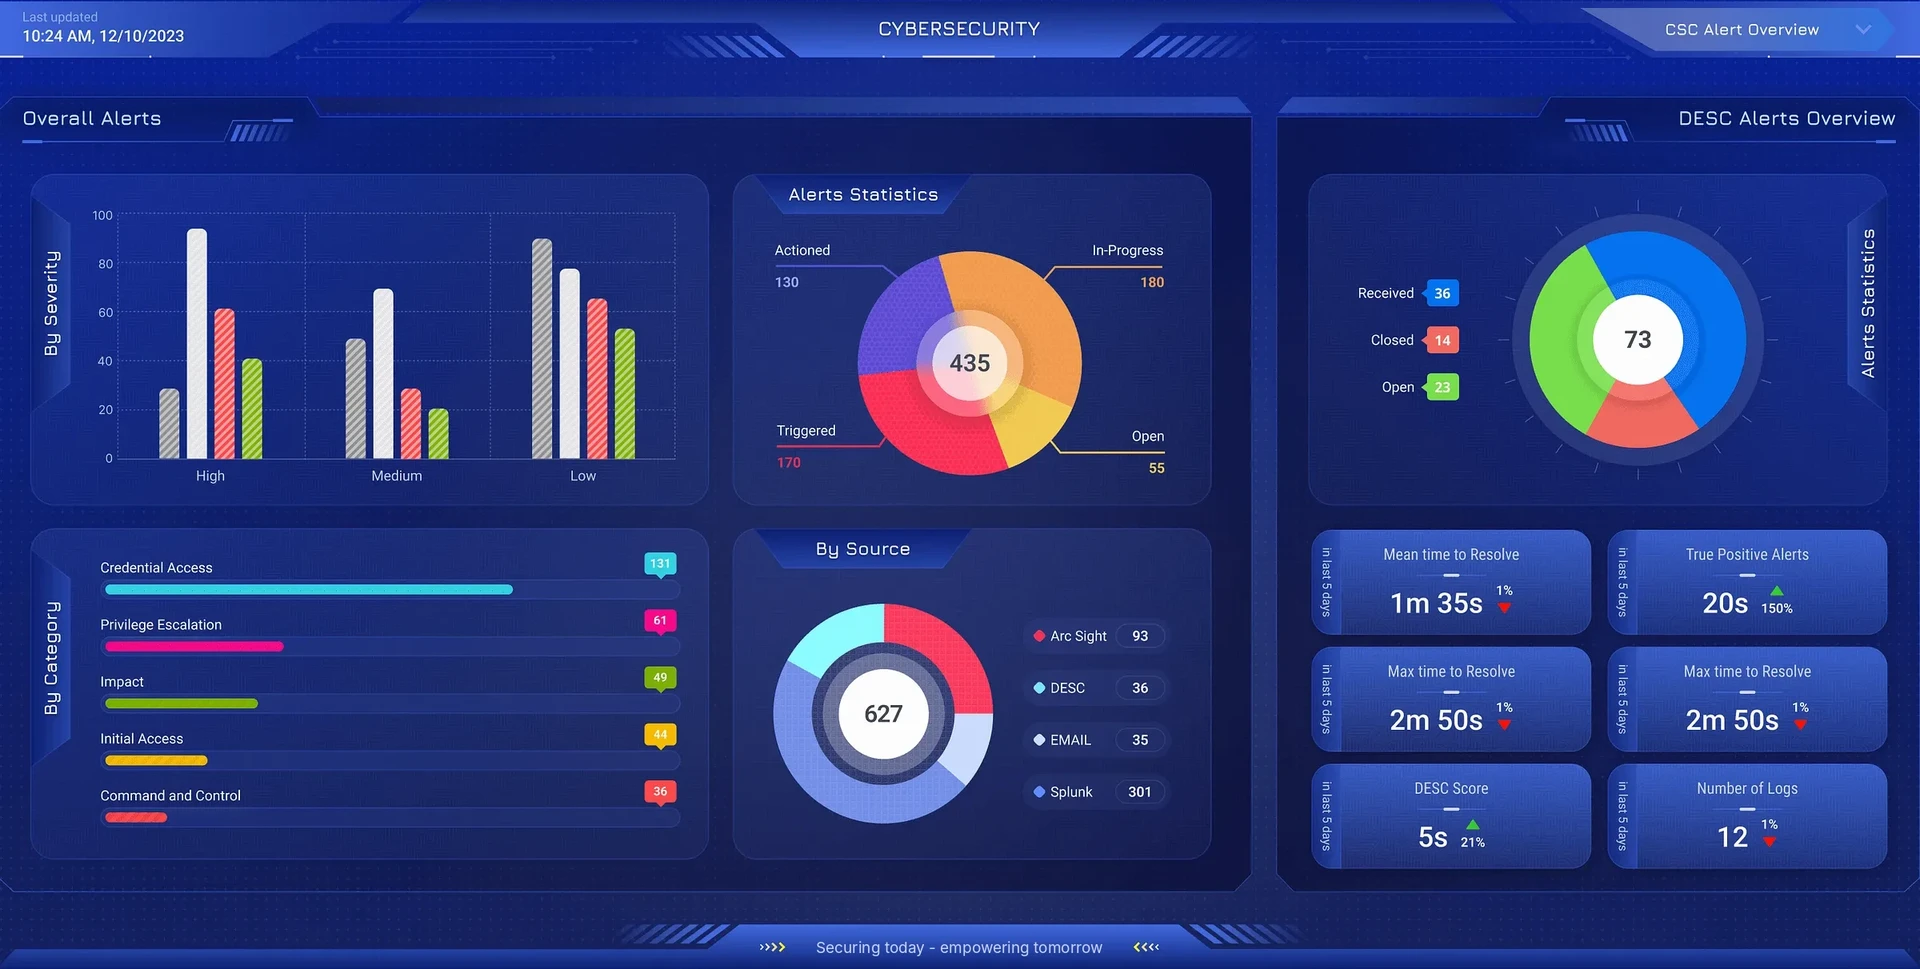
          Alerts by severity and category, their state, their source and the time to resolve.

        13. Who is behind it

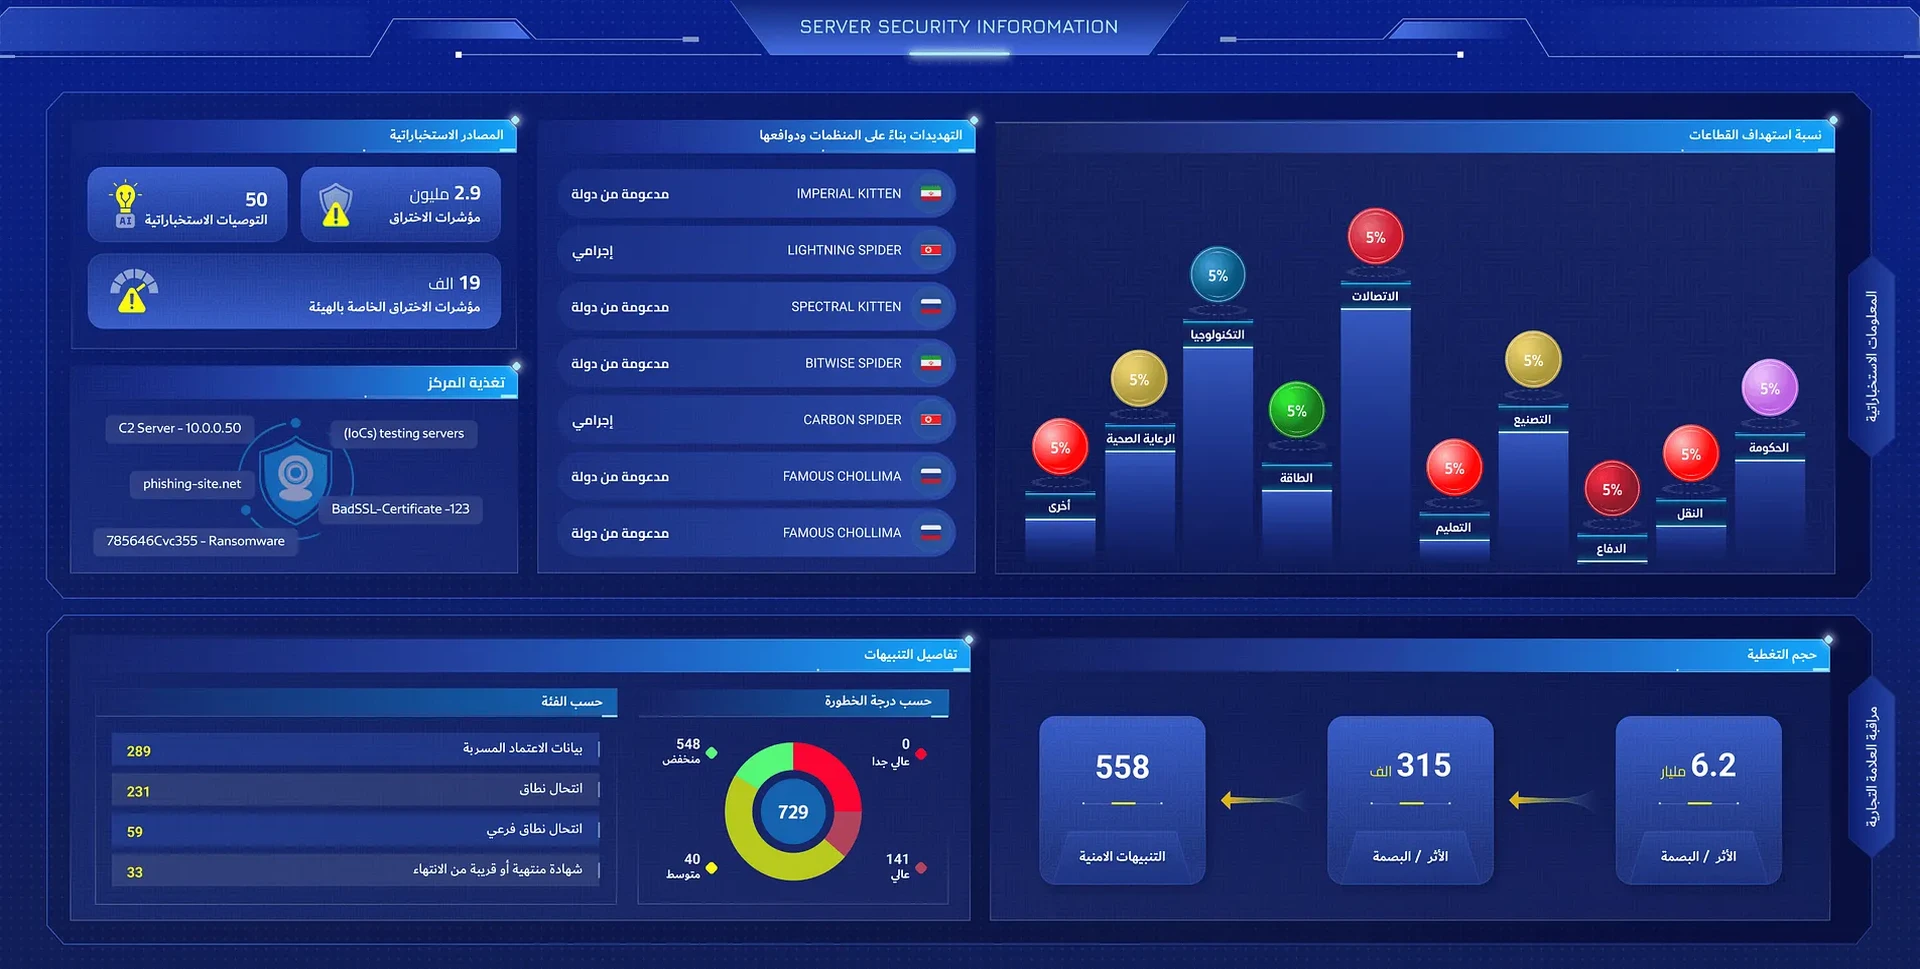
          Threat groups and their motives, indicators of compromise, the sectors targeted and the alerts raised.

        14. What’s protected

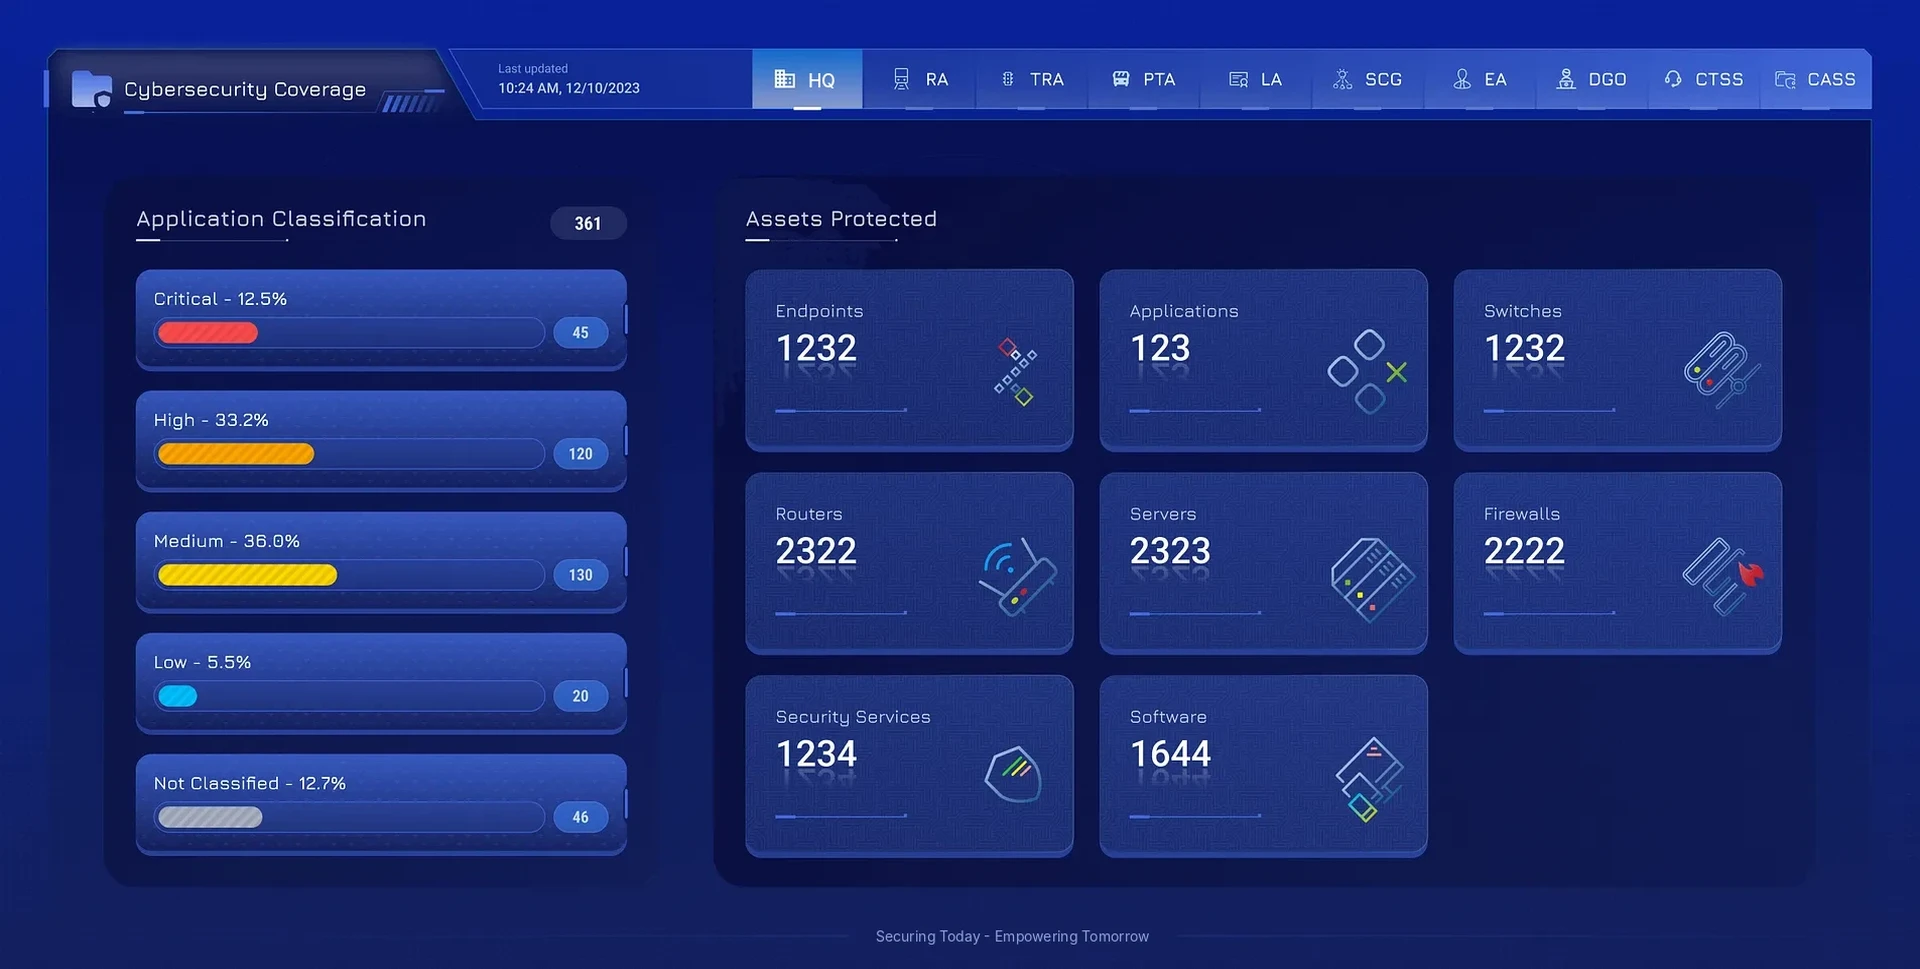
          Applications by classification and every kind of asset covered, agency by agency.

        01 / 14
        Security Risk · Risks
        Security risk management: risks on the city map by agency, gauges, risk aging and the lifecycle
        Security risks on the day map, with revised and residual risks and the share overdue
        Security risks in black: sector scores, cumulative risks by year and breakdown by risk group
        Security risks in Arabic, right to left
        The security risk heatmap: agencies as bubbles by risk and growth
        Security findings: counts, the city map, overdue, lifecycle, findings by source and aging
        Security findings in black: totals split internal and external, time to resolve by severity
        Findings by audit: totals, open findings and open findings by type
        Internal and external findings either side of the world attack map
        Findings totals across internal and external, over the world map
        Attacks by country on a globe, types of attack, and the top five countries per type
        Cybersecurity alerts by severity, category, state and source, with resolve times
        Threat intelligence: groups and motives, indicators, targeted sectors and alerts
        Cybersecurity coverage: applications by classification and assets protected
        Next

        More company work